One Score Isn't Enough
Data filtering methods typically assign each training sample a single quality score. This assumes quality is one-dimensional. It isn't.
When training requires multiple capabilities — visual understanding, OCR, STEM reasoning — a single scorer can't maximize signal for all of them simultaneously. Quality is better understood as multidimensional, with each axis corresponding to a capability the model must acquire.
Methods like CLIP score filtering measures image-text alignment but says nothing about reasoning utility. DataRater, a meta-learned scorer, works well for text but underperforms on multimodal data. The reason: the capabilities we care about have near-orthogonal data requirements. Compressing them into one scalar forces tradeoffs.
Useful for what?
The input is shared. What teaches each rater is not.
Rater Per Capability
We decompose filtering into specialized raters, one per capability, each trained via meta-learning on a disjoint validation objective. A curriculum progressively tightens selection thresholds, preserving diversity early while concentrating on high-value samples late.
We instantiate three raters:
-
Visual Understanding Rater: Trained on SEED-Bench, A-OKVQA, VSR
-
OCR Rater: Trained on TextVQA, ChartQA, RD-Tablebench
-
STEM & Knowledge Rater: Trained on M3Exam, MathVista, AI2D
Each rater is a ~50M-parameter transformer operating on features from a shared SigLIP 400M encoder. The bilevel optimization follows DataRater's template: inner-loop SGD updates the base model with rater-weighted losses, outer-loop meta-gradients update the rater to improve its capability-specific validation objective.
Training SkillRaters with Bilevel Meta-Learning
SkillRater builds on the DataRater bilevel optimization framework, but runs it independently per capability. The setup is a bilevel problem: an outer loop learns the rater, an inner loop trains the model using rater-weighted losses.Our training corpus was MAmmoTH-VL and the inner model was based on Isaac 0.2.
A rater assigns each training example a scalar weight . The goal is to find weights that improve performance on a held-out validation set. DataRater frames this as a bilevel optimization:
The model learns from data. The rater learns from the result.
Rater
Scores examples
FixedModel
Learns from weighted data
UpdatingValidation
Tests one capability
FixedThe validation signal returns to the rater.
The rater weights the examples. Those weighted losses update the model; the rater stays fixed.
Scroll to read the full equation.
The outer objective minimizes validation loss on the model state that results from training with rater-weighted losses. In practice, is approximated by running a finite number of inner-loop SGD steps.
In the inner loop, we initialize the base model parameters and run weighted SGD steps. For a minibatch and learning rate :
Scroll to read the full equation.
Each gradient step is weighted by the rater's scores — samples the rater considers high-value contribute more to the update. The post-inner-loop state is .
The rater parameters are then updated to improve held-out performance on this post-inner-loop state:
Scroll to read the full equation.
This is the meta-gradient: it tells the rater how to adjust its scores so that the resulting weighted training produces a model that does better on validation.
SkillRater's key extension is running this bilevel loop independently for each capability :
Scroll to read the full equation.
where is a capability-specific validation objective and is the corresponding rater. The inner loop uses the same shared training data, but each rater's outer-loop gradients come only from its own capability benchmarks. This is the structural difference from monolithic scoring: the Visual Understanding rater never sees OCR validation signal, and vice versa, so the raters are free to learn genuinely independent notions of quality.
Curriculum Over Union
After quality filtering, traditional top-k filtering forces a quality-diversity tradeoff and our experiments find that no single threshold wins across capabilities. We design a union curriculum that progressively tightens the threshold over training via a quadratic delay. Our ablation shows the curriculum achieves the best overall average (64.1%), exceeding the best static threshold (top-90% at 63.7%).
Many selections. One copy.
Illustrative samples: a dot means selected. Keep a sample if any rater selects it.
Kept once
Sample D is selected by Visual and OCR and STEM. It enters the union once, even when more than one rater selects it.
Results
We evaluate on held-out benchmarks never seen during rater training. All runs use the same training recipe at 2B parameters on Mammoth-10M. SkillRater presents a consistent win across all capabilities, showing further improvements on top of DataRater particularly in OCR and STEM, exactly where compressing orthogonal signals into one scalar hurts most.
Held-out capability benchmarks
2B parameters · Mammoth-10M · higher is better
| Category | Mammoth (Baseline) | DataRater | SkillRater Combined | SkillRater |
|---|---|---|---|---|
| 20.1% | 20.9% | 22.4% | 23.6%+2.7 pp | |
| 48.1% | 48.5% | 47.3% | 50.1%+1.6 pp | |
| 65.9% | 68.3% | 71.4% | 71.5%+3.2 pp | |
| 44.7% | 45.9% | 47.0% | 48.4%+2.5 pp |
OCR
Inspect a row to compare its exact scoresDataRater
48.5%
+1.6 pp
SkillRater
50.1%
Raters Transfers Across Model Scale
Raters trained at 1B parameters transfer directly to 2B without retraining. At both scales, curriculum with SkillRater outperforms the unfiltered baseline, and the gap widens over training steps.
Learn at 1B. Transfer to 2B.
Reconstructed charts · marker values estimated from the source image
1B Model
Curriculum ≈0.510Baseline ≈0.476
2B Model
Curriculum ≈0.671Baseline ≈0.648
Estimated values & source
Estimated from the visible marker centers in the original SkillRater scale-transfer figure. Rounded to 0.001; no hidden checkpoints or intermediate values were reconstructed.
| Model | Steps | Curriculum ≈ | Baseline ≈ |
|---|---|---|---|
| 1B | 25k | 0.413 | 0.464 |
| 1B | 50k | 0.471 | 0.493 |
| 1B | 75k | 0.520 | 0.456 |
| 1B | 100k | 0.510 | 0.476 |
| 2B | 25k | 0.610 | 0.619 |
| 2B | 50k | 0.624 | 0.633 |
| 2B | 75k | 0.660 | 0.632 |
| 2B | 100k | 0.671 | 0.648 |
The Raters Are Orthogonal
Across the full training corpus, pairwise Pearson correlations range from −0.011 (VQA–OCR) to 0.007 (OCR–STEM), with mean absolute correlation 0.020. PCA shows near-uniform variance across components (35.5%, 32.9%, 31.6%), yielding effective dimensionality 2.99 out of 3.0.
Top-10% selections from each rater align with distinct, linearly separable directions in score space. The raters select for genuinely complementary subpopulations.
This explains the gap over monolithic filtering: DataRater compresses low-correlation capability signals into one scalar. Decomposed raters avoid that compression because each optimizes its own axis.
We show that our capability-aligned raters learn orthogonal signals. Looking at the rated data across the full training corpus, we find the raters to be independent (mean absolute pairswise Pearson correlation: 0.020), additionally PCA shows near uniform variance across components yielding an effective dimensionality of 2.99/3.0.
This explains the gap over monolithic filtering: DataRater compresses low-correlation capability signals into one scalar. Decomposed raters avoid that compression because each optimizes its own axis.
Different raters find different signal.
Estimated scatter positions · exact printed correlations and PCA percentages
Top-10% selections in PCA space
Hover, tap or use arrow keys to inspect a reconstructed point.
Pearson correlation matrix
| VQA | OCR | STEM | |
|---|---|---|---|
| VQA | Not printed | ||
| OCR | Not printed | ||
| STEM | Not printed |
Select a pair to locate both raters in the scatter. Values are exact.
Full corpus
PCA variance
Three components, each close to one-third. These are not rater categories.
eff. dim = 2.99
Reconstruction method & estimated point coordinates
Colored dot centers were located in the source image, calibrated against the PC1/PC2 axis ticks and rounded to 0.001. Legend dots, text and directional arrows were excluded. The faint background reproduces only distinguishable centers—no random points were added. Arrow directions were traced from the same image.
| Point | PC1 ≈ | PC2 ≈ |
|---|---|---|
| VQA-1 | −0.157 | −0.009 |
| VQA-2 | −0.131 | −0.029 |
| VQA-3 | −0.138 | −0.042 |
| VQA-4 | −0.165 | −0.067 |
| VQA-5 | −0.118 | −0.079 |
| VQA-6 | −0.098 | −0.083 |
| VQA-7 | −0.038 | −0.086 |
| VQA-8 | −0.258 | −0.093 |
| VQA-9 | −0.189 | −0.097 |
| VQA-10 | −0.123 | −0.098 |
| VQA-11 | −0.037 | −0.100 |
| VQA-12 | −0.341 | −0.102 |
| VQA-13 | −0.010 | −0.106 |
| VQA-14 | −0.108 | −0.109 |
| VQA-15 | −0.174 | −0.109 |
| VQA-16 | −0.053 | −0.130 |
| VQA-17 | −0.070 | −0.158 |
| VQA-18 | −0.105 | −0.178 |
| VQA-19 | −0.032 | −0.198 |
| OCR-1 | 0.171 | 0.002 |
| OCR-2 | 0.137 | −0.024 |
| OCR-3 | 0.196 | −0.026 |
| OCR-4 | 0.215 | −0.037 |
| OCR-5 | 0.079 | −0.057 |
| OCR-6 | 0.109 | −0.062 |
| OCR-7 | 0.087 | −0.096 |
| OCR-8 | 0.084 | −0.106 |
| OCR-9 | 0.053 | −0.146 |
| OCR-10 | 0.067 | −0.151 |
| OCR-11 | 0.104 | −0.198 |
| OCR-12 | 0.085 | −0.226 |
| STEM-1 | −0.069 | 0.189 |
| STEM-2 | 0.042 | 0.179 |
| STEM-3 | 0.158 | 0.178 |
| STEM-4 | −0.101 | 0.173 |
| STEM-5 | −0.013 | 0.141 |
| STEM-6 | 0.031 | 0.139 |
| STEM-7 | 0.073 | 0.136 |
| STEM-8 | −0.121 | 0.136 |
| STEM-9 | 0.002 | 0.116 |
| STEM-10 | −0.027 | 0.106 |
| STEM-11 | −0.049 | 0.094 |
| STEM-12 | −0.055 | 0.091 |
| STEM-13 | 0.001 | 0.086 |
| STEM-14 | −0.008 | 0.073 |
| STEM-15 | 0.025 | 0.071 |
| STEM-16 | 0.053 | 0.067 |
| STEM-17 | −0.017 | 0.065 |
| STEM-18 | −0.115 | 0.056 |
| STEM-19 | 0.025 | 0.045 |
| STEM-20 | 0.010 | 0.033 |
| STEM-21 | 0.035 | 0.029 |
| STEM-22 | 0.090 | 0.019 |
| STEM-23 | 0.031 | 0.017 |
| STEM-24 | 0.042 | −0.004 |
| STEM-25 | −0.042 | −0.014 |
What Gets Retained vs. Filtered
-
STEM: Retained samples require multi-step reasoning about physical properties. Filtered samples are shallow recognition tasks.
-
OCR: Retained samples require reading and interpreting embedded text in context. Filtered samples don't use text meaningfully.
-
Visual Understanding: Retained samples require grounded visual reasoning — inferring design, spatial relationships, strategic placement. Filtered samples are generic structural descriptions.
SkillRater Quality Examples
STEM Rater
Reason about physical properties

Q: Considering the coat, what season is it most appropriate for, and what characteristics make it suitable?
A: The coat is most appropriate for winter. Its thick fabric is ideal for insulation...
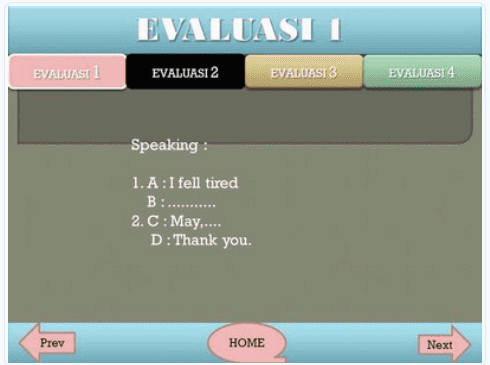
Q: What educational concept is being assessed by the speaking exercise in the image?
A: The concept appears to be conversational skills in English, the ability to respond...
OCR Rater
Read embedded text in context

Q: What does the use of quotation marks around "Madrid" imply about the presenter's intention?
A: The quotation marks suggest Madrid is significant in the life of Benito Pérez Galdós...

Q: Considering the digital manipulation, what can we infer about the skills required?
A: We infer high skill in photo editing. Such a composite requires color matching...
Visual Rater
Ground reasoning in the scene

Q: Considering the design and location of the lighthouse, what might be its historical significance and its role in maritime navigation?
A: The lighthouse on the breakwater likely serves as a navigational aid for vessels. Its historical significance may stem from ensuring maritime...

Q: Considering the table's design, what factors contribute to its stability?
A: Primary factors include the outward leg angle and central cross support...
Takeaways
Data quality is intrinsically multidimensional. Decomposing filtering into capability-aligned raters produces near-orthogonal scoring functions and outperforms both unfiltered training and monolithic learned filtering. Curriculum scheduling over the union of rater scores resolves the conflicting quality-diversity tradeoffs that defeat static thresholds.
This isn't specific to multimodal mid-training. Text pretraining, code generation, and instruction tuning all involve competing capability demands — scalar quality scores likely face the same compression bottleneck.
Try Isaac Now
We believe in building in the open and empowering the community. You can start creating with Isaac today.
